The Keetch-Byram Drought Index (KBDI) is used by the Florida Forest Service to indicate the dryness of the soil and surface fuels. High values of the drought index are associated with severe wildfire outbreaks such as occurred during 1998. However, no threshold point has previously been determined to indicate that conditions are far above normal and warrant concern. Using 35 years of rainfall and temperature measurements from 9 locations throughout the state average KBDI values are determined for the state on a regional basis. These regions are North (stations used are Pensacola, Tallahassee and Jacksonville), Central (Daytona, Melbourne and Orlando) and South (Tampa, Fort Myers and Miami). This work operates under the premise that wide spread drought is accompanied by severe wildfire outbreaks. The average KBDI is compared to recent levels of fire activity (1981-present) to determine threshold levels that indicate above normal fire activity.
The mean drought conditions show a wide range of variability by region (Figure 1). Winter conditions are driest in the south and become wetter to the north as the central and northern regions experience a greater frequency of frontal passages. During the summer, convective activity produces significant rainfall particularly in the southern part of the state. Florida's fire season is clearly event in Figure 1 with the increased activity beginning in January and peaking in May and June. All three regions exhibit a peak in their KBDI around May-June period. Drought conditions are high during the fall but fire activity is at a minimum. This shows the need for any threshold values to be determined on a monthly basis to account for the seasonal variation in fire activity.
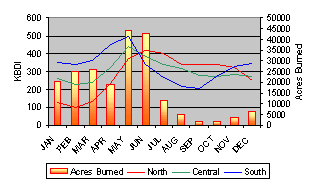
Figure 1. Mean regional KBDI along with mean number of acres burned statewide
The next step in determining potential threshold values is to develop a definition of above average fire activity and drought conditions. Average values alone are not enough as the averages vary by month so it is difficult to establish definitions that are consistent month to month. If the monthly mean is subtracted from the data to produce anomalies and then this value is normalized by the standard deviation of that mean, all data is then referenced to a common scale. On this common scale, mean conditions are represented by a value of zero.
Figure 2 shows above average fire seasons from 1981-1998. Significant fire seasons (1985, 1989, etc.) are clearly evident in this figure. Significant fire seasons are identified as having normalized values in excess of 1.0 which represents an average of 24,000 acres above normal.
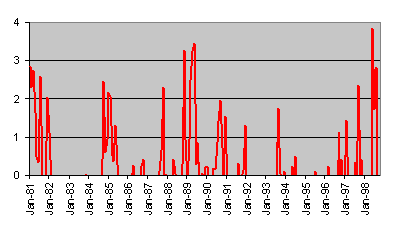
Figure 2: Normalized fire activity for 1981 - 1998
Significant levels of drought are determined by normalizing the KBDI in a similar manner as to the fire activity. Thirty-five years of data are used in determining the mean and standard deviation of the KBDI on a daily basis (Figure 2). The threshold values of KBDI are determined by comparing the drought to the fire activity.
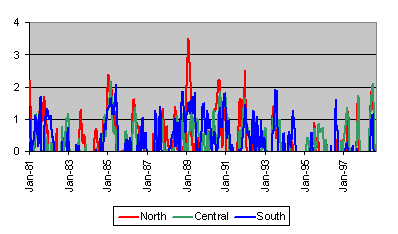
Figure 3: Normalized KBDI for 1981-1998. Values greater than 1.0 are coincident with above normal fire activity.
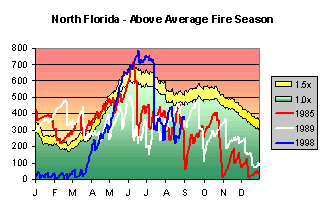
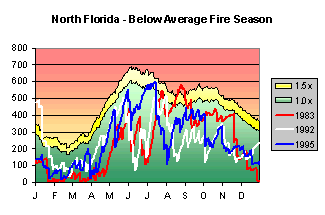
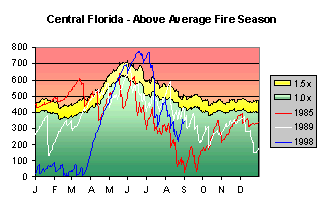
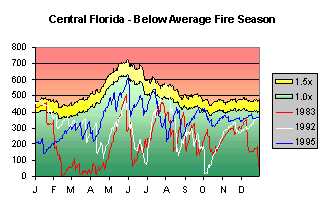
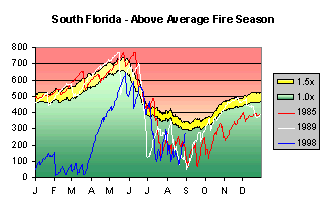
Moderate drought conditions occur when the normalized KBDI exceeds 1.0 and more severe drought conditions occur when the normalized KBDI exceeds 1.5. Using these guidelines, when the normalized KBDI went above 1.0 (moderate drought), 98.5% of the time a moderate to severe fire season occurred. When the normalized KBDI exceeded 1.5, the fire season was always above average (most were severe). The following figures show several applications of these guidelines to both severe and typical fire seasons.
|
|
|
|
|
|