According to the U.S. Department of Agriculture (USDA) Florida 2024 Annual Statistical Bulletin, Florida’s 44,400 farms and ranches utilized 9.7 million acres and continue to produce a wide variety of safe and dependable food products. From the citrus groves, other produce, and the nurseries in central and southern Florida, to the cattle and calves throughout the state, these farms and ranches provide Florida with a large and stable economic base.
In 2024, in terms of agricultural value of production, Florida accounted for:
Product | Percent of U.S. Value | Value in Dollars |
|---|---|---|
Valencia Oranges | 34% | $106.4 million |
Watermelons | 29% | $198 million |
Bell Peppers | 32% | $200.9 million |
Grapefruit | 19% | $28.7 million |
Sweet Corn | 33% | $293 million |
All Oranges | 15% | $162 million |
Total Floriculture Sales | 18% | $1.21 billion |
Fresh Market Tomatoes | 17% | $330.9 million |
Strawberries | 14% | $540.3 million |
Cabbage | 10% | $67 million |
Source: USDA National Agricultural Statistics Services
Farms and Land in Farms
Florida had 44,400 commercial farms in 2024, using a total of 9.7 million acres. There were 6,400 farms with sales exceeding $100,000. The average farm size was 218 acres. Florida ranks 16th among all states in number of farms and 29th in land in farms.
Year | Total Number of Farms | Total Acres | Average Farm Size |
|---|---|---|---|
| 2024 | 44,400 | 9,700,000 | 218 |
| 2023 | 44,400 | 9,700,000 | 218 |
2022 | 47,700 | 9,700,000 | 217 |
2021 | 46,200 | 9,700,000 | 210 |
2020 | 46,800 | 9,700,000 | 207 |
Source: USDA National Agricultural Statistics Services
Cash Receipts 2023
The USDA's Economic Research Service reports cash receipts in 2023 totaled to $9.24 billion. This is up 4% from last year’s $8.88 billion. All crops accounted for 76% of total cash receipts. The leading crop commodities were floriculture (13.1% of all cash receipts), sugarcane for sugar and seed (9.8%), oranges (2.42%) and tomatoes (4.9%). Cattle and calves in addition to dairy products comprised 8.4% of total cash receipts.
Commodity | 2023 Cash Receipts | Percent of Total |
|---|---|---|
All Commodities | $9,244,557,000 | 100% |
Citrus | $285,297,000 | 3.09% |
Other Fruits | $519,274,000 | 5.62% |
Vegetables and Melons | $1,663,933,000 | 18% |
Field Crops | $369,248,000 | 4% |
Sugarcane and Seed | $908,690,000 | 9.8% |
Floriculture | $1,208,025,000 | 13.1% |
Other Crops | $1,811,306,000 | 19.6% |
Milk | $506,168,000 | 5.5% |
Cattle and Calves | $774,943,000 | 8.4% |
Other Livestock | $327,089,000 | 3.5% |
Source: USDA National Agricultural Statistics Services
Vegetables, Melons and Berries
The 2024 value of production for the published major berries, spring potatoes, vegetable crops and watermelons totaled $3 billion, up 36% from the comparable 2023 value.
- Strawberries
- Tomatoes
- Sweet Corn
- Bell Peppers
- Watermelons
- Spring Potatoes
- Snap Beans
- Blueberries
- Cabbage
- Cucumbers
- Squash
The crops that increased in percentage value were strawberries (+25%), sweet corn (+1/6%), blueberries (+16%) and bell peppers (+7%). The crops that decreased in percentage value included cucumbers (-52%), spring potatoes (-49%), tomatoes (-33%), snap beans (-27%), watermelons (-25%), squash (-7%) and cabbage (-3%).
Citrus
United States citrus utilized production for the 2023-2024 season totaled 5.24 million tons, up 6% from the 2022-2023 season. California accounted for 79% of total United States citrus production, Florida totaled 17%, and Texas and Arizona produced the remaining 4%.
Florida’s share of U.S. citrus production in 2023-2024 was 20.2 million boxes, up 12% from the previous season’s 18.1 million boxes. Florida's orange production, at 18.0 million boxes, was up 14% from the previous season. Grapefruit utilization in Florida, at 1.79 million boxes, was down 1% from last season's utilization. Tangerine and tangelo production in 2023-2024 was down 6% from the previous season.
Florida Citrus Production
Citrus Crop Year | Sales On-Tree Value |
|---|---|
| 2023-2024 | $220,707,000 |
| 2022-2023 | $193,949,000 |
2021-2022 | $500,583,000 |
2020-2021 | $612,716,000 |
2019-2020 | $696,170,000 |
2018-2019 | $902,374,000 |
2017-2018 | $636,747,000 |
Source: USDA National Agricultural Statistics Services
Forestry
The state of Florida has 17.16 million acres (26,807 square miles) of forestland, representing 50% of the state’s total land area. The state has extensive natural and planted pine and hardwood forests that are commercially utilized for production of a wide variety of wood building materials, consumer paper and packaging products, chemicals and renewable biomass fuels. Nearly two-thirds of Florida’s forestlands are privately owned by industry, corporations, families or individuals.
2017 employment impacts were 114,590 full- and part-time jobs, and 3.79 billion in wages paid. The largest sector was landscaping services, with nearly 10,000 establishments, 73,382 employees and $2.30 billion in wages, followed by nursery and floriculture production (19,144 jobs), lawn and garden stores (6,383 jobs), and nursery/florist wholesalers (6,226 jobs).
Field Crops
The 2024 total value of production for corn for grain, cottonseed, hay, peanuts and upland cotton for lint totaled $334 million, a decrease of 11% from the previous year’s total of $374 million. Cottonseed total value of production was down 2% and was valued at $4.9 million. Corn for grain total value of production was down 43% and was valued at $30.1 million. Upland cotton for lint total value of production increased 0.7% and was valued at $39.6 million. Peanut total value of production was up 9% and was valued at $149 million. Hay total value of production decreased 21% and was valued at $109 million.
Livestock
All cattle and calves on Florida farms and ranches as of January 1, 2025, including dairy cattle, totaled 1.56 million head, the same amount as 2024. Beef cows in Florida were up 3,000 head from 2024. Among the states on January 1, 2025, Florida ranked in ninth in beef cows and 18th in total cattle. Calves born during 2024 totaled 770,000, up 10,000 from 2023.
Market Value of Agricultural Products Sold Including Food and Marketing Practices and Value-Added Products: 2022
This information is provided by the USDA's Ag Census every five years. The next update will be in 2029.
| County | Total |
|---|---|
| Palm Beach | $1.25 billion |
Miami-Dade | $1.14 billion |
Hillsborough | $704 million |
Hendry | $633 million |
Orange | $395 million |
Collier | $388 million |
Manatee | $322 million |
Polk | $304 million |
Okeechobee | $302 million |
Suwannee | $290 million |
Lake | $277 million |
Volusia | $251 million |
Hardee | $229 million |
Highlands | $225 million |
Marion | $221 million |
DeSoto | $218 million |
Gilchrist | $216 million |
Madison | $169 million |
Lafayette | $153 million |
Alachua | $146 million |
Levy | $145 million |
Pasco | $137 million |
Lee | $133 million |
Glades | $125 million |
Indian River | $124 million |
Martin | $121 million |
Jefferson | $115 million |
Saint Lucie | $112 million |
Jackson | $112 million |
Osceola | $99 million |
Brevard | $87 million |
Sumter | $86 million |
Putnam | $75 million |
Charlotte | $67 million |
Santa Rosa | $64 million |
Columbia | $64 million |
Broward | $63 million |
Flagler | $59 million |
Saint John’s | $58 million |
Hamilton | $53 million |
Gadsden | $49 million |
Sarasota | $49 million |
Escambia | $46 million |
Walton | $39 million |
Hernando | $37 million |
Holmes | $31 million |
Calhoun | $28 million |
Citrus | $24 million |
Bradford | $22 million |
Taylor | $22 million |
Baker | $21 million |
Seminole | $16 million |
Nassau | $15 million |
Leon | $13 million |
Wakulla | $11 million |
Dixie | $11 million |
Monroe | $11 million |
Washington | $9 million |
Union | $8 million |
Pinellas | $7 million |
Duval | $7 million |
Clay | $7 million |
Okaloosa | $6 million |
Bay | $4 million |
Gulf | $3 million |
Liberty | $3 million |
Franklin | $1 million |
Source: USDA National Agricultural Statistics Service
Florida Agricultural Exports
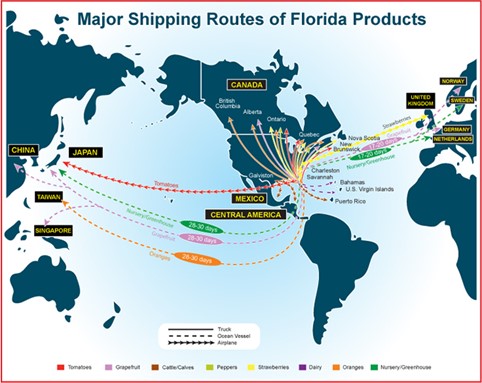
Top Florida Agricultural & Related Products Export Commodities — 2024
| Commodity Group | Export Value |
|---|---|
| Dairy Products | $506.9 million |
| Seafood Products | $394.0 million |
| Beef & Beef Products | $413.5 million |
| Poultry Meat & Productions (Excluding Eggs) | $450.3 million |
| Soup and Other Food Preparations | $363.9 million |
| Fresh Fruit | $364.4 million |
| Forrest Products | $356.2 million |
| Distilled Spirits | $334.4 million |
| Fresh Vegetables | $358.1 million |
| Essential Oils | $362.7 million |
Source: U.S. Census Bureau Trade Data
Florida's Agricultural & Related Products Export Commodities Export Partners — 2024
| Country | Total |
|---|---|
| Canada | $1.066 billion |
| Dominican Republic | $474.2 million |
| Mexico | $460.1 million |
| The Bahamas | $445.7 million |
| Cuba | $250.5 million |
| Netherland Antilles | $242.1 million |
| Panama | $240.9 million |
| Guatemala | $209.6 million |
| Colombia | $193.1 million |
| Costa Rica | $193.1 million |
Source: U.S. Census Bureau Trade Data
